Skip to content


Of course, you can perform UX research data analysis without tl;dv, but that’s just silly. We mentioned it’s free, right? By ignoring tl;dv, you’d spend more time, more money, and get less valuable insights in a poorly organized manner. That’s why UX designers and researchers commonly recognize tl;dv as one of the best remote UX research tools.
Find the Balance Between Being Open Minded and Having a Plan
While it’s important to gather data in a way in which you prepare for the analysis stage, it’s even more important to start with an open mind. Don’t make the mistake of leaning into researcher bias by planning your analysis so thoroughly in advance that you end up seeking the answers you want to find. That’s not how user research works.
However, it’s a great tip to begin the research process with an open mind, and have a plan in place for how to collect, store and easily re-access the data insights you gain along the way.
You don’t want to think about your analysis for the first time after you are buried in ten foot of data. Start right from the beginning. Your interview process should be structured in a way that helps you analyze small findings.
Screen your target audience before interviewing them to make sure you have the best and most insightful users. This is especially important if you’re sourcing interview users from social media and other public sources that are not your own app users. Come up with an interview plan to get the most out of your research.
Throughout the entire research period, keep your goals in mind, but not so much that they become overbearing. The real skill of user interviews is listening. Sure, you must ask the right people the right questions, but if you aren’t listening to what they actually say, you are shooting yourself in the foot. Don’t let your own thoughts or expectations even enter the picture. This is time for your users to speak and it’s time for their voices to be heard: by you!
Again, tl;dv can help here as one of the best voice of the customer tools. You have a permanent record of what your user said, how they said it, and the mannerisms they displayed while talking. Don’t rely on memory, or hastily scrawled notes. You have transcriptions available in over twenty languages, unlimited meeting recordings, and the ability to timestamp every single bit of info you want to return to. And all that is free!
@tldv.io Makes perfect sense. #meeting #comedy #corporate #meetings #9to5 #firstday
♬ original sound - tldv.io - AI Meeting Recorder
Identify Your Goals
You want to improve your app? Too vague. Maybe you want to build a detailed and intimate understanding of who your audience and ideal users are, what motivates them, and how they act upon their goals on a daily basis. In which case, your research is better off being designed to identify patterns in the daily behavior of the interviewees.
In addition, keep on the lookout for demographic details, lifestyle patterns, and various attitudes of users. You can even write your own user interview discussion guide to make sure you direct the conversation in the right way.
On the other hand, if your objective is to test a new feature or upcoming app, then your focus could be on pain points, satisfaction points, and trying to rank them based on priority.
Not only do you need to work out how to ask the right questions so that the user feels comfortable revealing what they think, you need to track the data in a way that you can use for a variety of purposes. Depending on who you will share your user research data analysis with, you may need to have a think about granularity. Are you pitching to your design team, or the stakeholders? Do you need to give specific examples, or just general trends? Plan in advance.
Prepare Your Hypothesis (If Needed)
Hypotheses are important in certain fields of research. Usability tests, for example, call out for a hypothesis, because you will need to focus on specific areas that need improvement. You will need to, somewhat, understand the problem and the potential solution, before diving into user research.
However, not all research requires a hypothesis. And in some cases, it downright tarnishes the data. If you run a series of user interviews, expecting pain point A to be the problem, then that’s exactly what you’ll hear about. It’ll create a skewed view of the problem at hand, leading to biased data, which leads to wasted product development as the core issues are overlooked.
Sometimes, you can start running small analyses once data starts to come in. To guarantee that user interviews are conducted with quality, there should be no more than 4 per day. Preferably 2 or 3. There needs to be space in between interviews so that researchers can review and label the notes. It also gives them time to debrief with the note-taker if there is one, or scan through the notes on tl;dv.
A superficial semi-analysis can be conducted half-way through the user interviews. You can also use this digestion time to review your questions, perhaps tweaking them here and there to bring out better answers in future interviews.
This method will prevent you from trying to drown yourself in your own tears after a ram-packed day of user interviews, with only hastily scribbled notes and a half-functioning brain to try and unscramble them.
@tldv.io Different kinda breakdown pal #breakdown #9to5 #latetowork #dayinthelife #corporatehumor IB: @punhubtiktok
♬ original sound - tldv.io - AI Meeting Recorder
Discovery on the Go
Product development is heavily dependent on quality research through user research, interviews, and testing. UX design is also based on thorough research. Building a product based entirely on your fantasies about what it should be is the quickest route to sh*t’s creek. And you’d best believe there are no paddles there either.
User research will help you discover the golden nuggets you need to create the product that users will love. Whether you’re thinking about features, functions, or other aspects of your application, it’s important to find out the opinions of real users. It’s more expensive to fix a development problem later on than to build a solution at the beginning.
In some cases, it’s possible to find brand new use cases through user research by listening to what your future users want. This can help you position yourself as a leader in the niche, setting yourself up for success in a saturated market.
It Never Stops
If there’s one thing you should know, it’s that user research data analysis doesn’t stop. It doesn’t sleep. It doesn’t feel pity, or remorse, or fear. Okay, I may have started talking about the Terminator somewhere there, but it doesn’t change the fact that analysis is an ongoing process.

One of the best ways to keep tabs on progress, and organize your key insights is by taking notes. Not the twentieth century way of taking notes with pen and paper, no, no, no. With tl;dv’s note-taker.
By recording sessions with tl;dv, you can share snippets or entire sessions of videos with stakeholders for appropriate action. Taking notes does not only help you analyze stuff on the go; it helps you keep an account of things as they happen. It’s the best way to keep track of all your collected data.
One way to do this, whether with qualitative or quantitative research, is to have short sessions with your fellow researchers after each interview. You can review their responses together and make additional notes. It’s always good to review a user interview before moving onto the next one.
Break Your Data Down
Pooling data at the end of your research is one of the easiest ways to get discouraged by the sheer amount of data that you have. Don’t fret, not all data is the same. And at this stage, knowing how to find gold in your data is the skill you need.
To achieve the best results, start by cleaning up your notes and complementing them with contextual information (with the help of your recorded meetings). Differentiate between a description and an interpretation. The analysis phase is time to interpret.
Next, categorize your data into various analysis areas that will allow you to weigh different data in terms of importance and priority.
Having such a list is important in order to determine what is important now, and what will be nice to have later on. This kind of analysis is particularly important when you have few resources to execute your findings; you want to focus on only the things that will bring maximum impact to your users and help you achieve your designated objectives.
That means putting away all the nice (but non-essential) ideas in a basket for later and allowing the development team to build what is absolutely necessary at each point in time.
Prioritization starts with the UX research design, based on the organizational objectives stakeholders have set for the project. To ensure that you get the necessary information to meet those requirements, you need to keep the objectives at the back of your mind and have a way of sorting your data.
How to Prioritize Your UX Research Data Analysis
1. Thematic Analysis
Thematic analysis is basically putting your data into “buckets” for consideration. By breaking down your data into well-organized buckets, you are able to consider every little detail based on its theme as well as the general importance of that thematic bucket.
One way to start doing this is to color code themes. When reviewing transcripts, give each nugget of data a color according to its theme. This can be done at the end of the day, or shortly after each session to ensure that you do not lose perspective on each interview. Together with your notes, you can easily color code your auto-generated transcripts from tl;dv.
If you’re struggling to decide upon a theme, simply bulk data together that has a similar meaning, scope, or premise. If you come across the same thing being said over and over, it’s a good idea to make it into a theme and store all the data about the topic there.
According to the Nielsen Norman Group, there are six (6) steps for data analyses for thematic areas.
Step 1; Gather your data
Step 2; Read all of your data from start to finish.
Step 3; Code your text with thematic areas
Step 4; Create new codes to encapsulate new themes
Step 5; Take a break for a day
Step 6; Evaluate your themes for good fit
It’s a smart idea to create a legend or coding key so that your colleagues can understand your data too. An example of a text coding key is:
-
- Red – pain points
-
- Green – positives
-
- Gray – user suggestions
-
- Yellow – apps used daily
Source; NVIVO BLOG
2. Affinity Diagrams
The affinity diagram is a way to visually organize all the facts by putting them in various categories (or topic clusters). The affinity diagram is often done with a pen and paper, but it can also be perfectly executed in a kanban style with tools like Trello. The affinity diagram is called different names such as collaborative sorting, snowballing, and sometimes affinity mapping.
Example of affinity mapping:
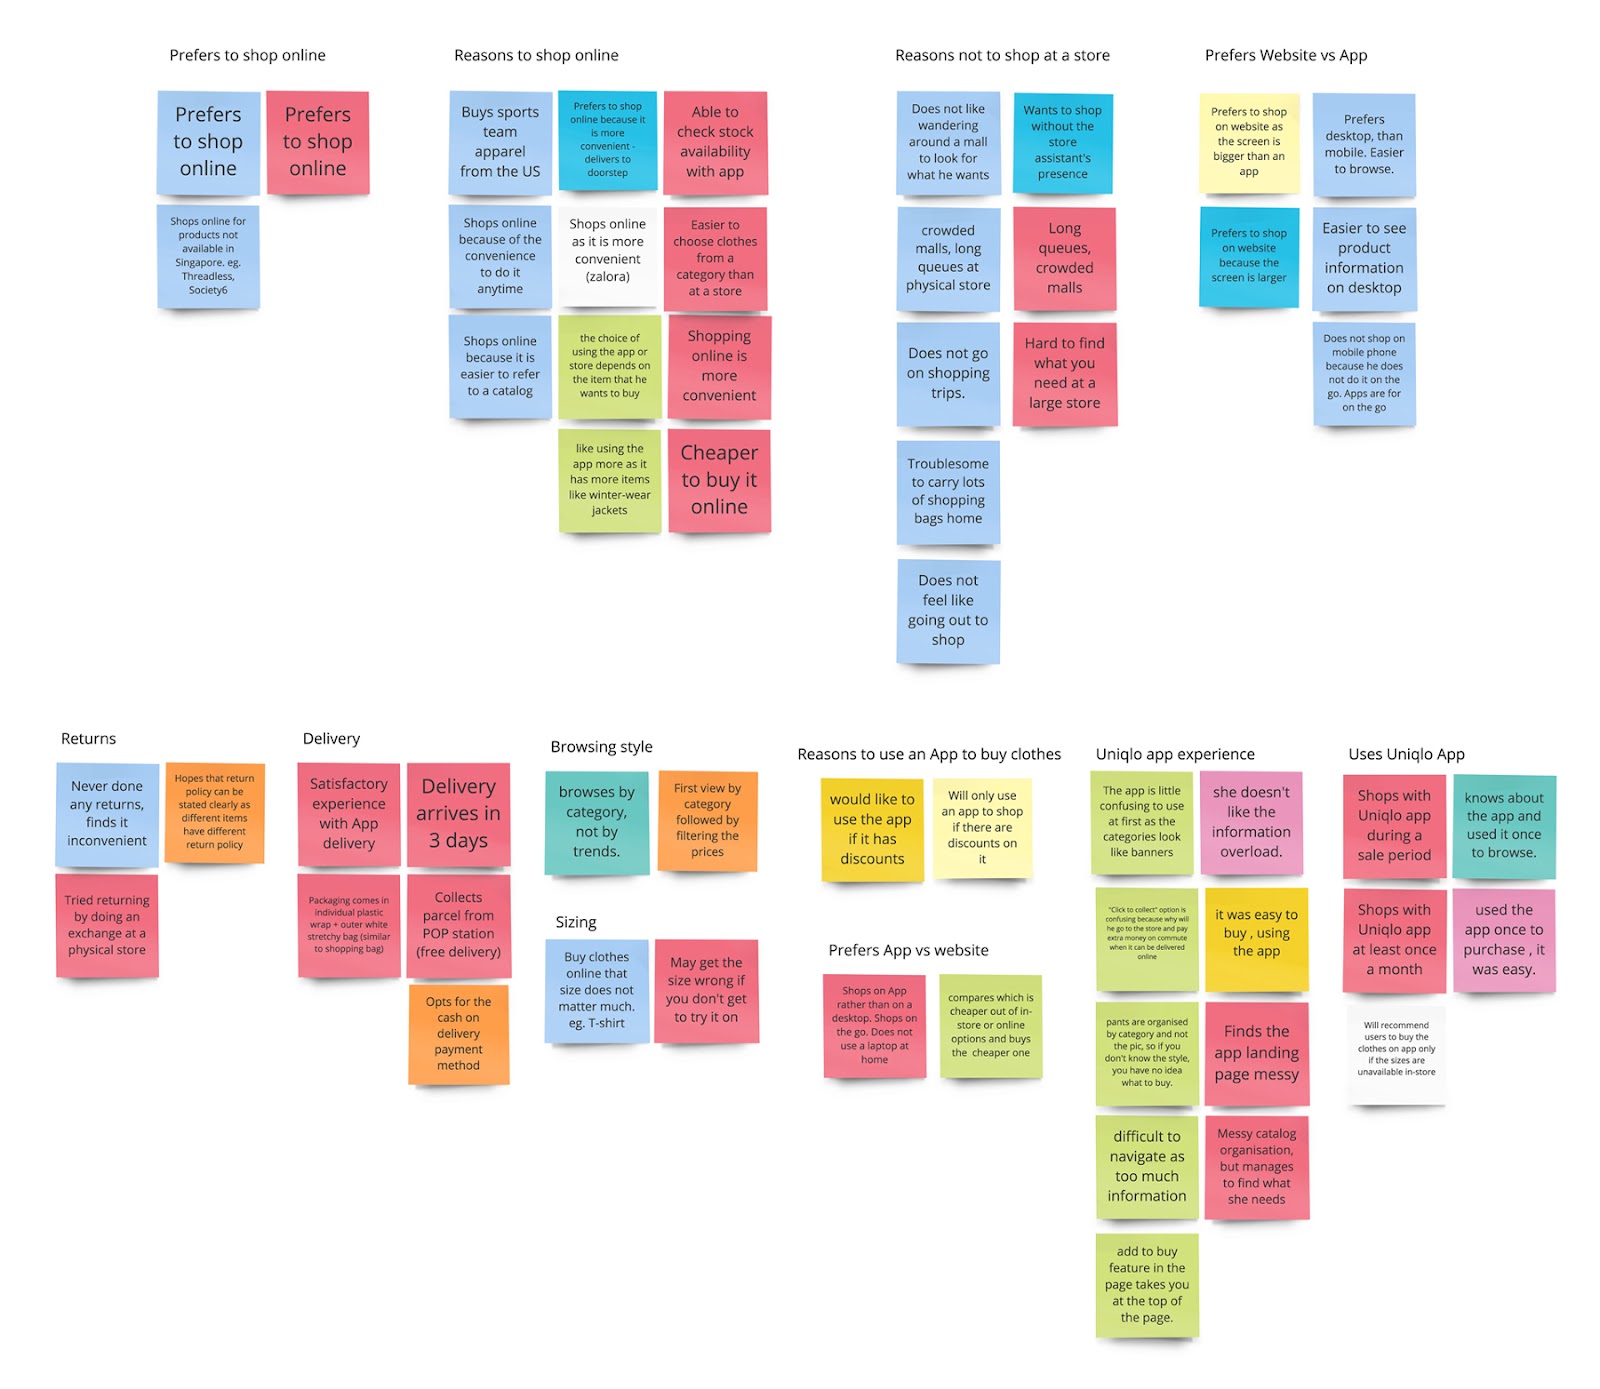
Source: Leow Hou Teng
What is the Difference Between Affinity Diagrams and Thematic Areas in User Research?
Hierarchical thematic analysis is a process of breaking down your data into themes and then sub-themes. This is done by reading through all the transcripts, interview notes, and other relevant data, and then coding your data for various themes. Thematic areas are generally broader in scope than affinity diagrams. An affinity diagram will present smaller topics or clusters that can be further explored.
The thematic analysis involves sorting your data into themes in order to better consider each detail, while affinity diagramming involves grouping facts together by topic. Both methods can be used to develop a better understanding of your users and improve your product accordingly. They are not the same and can be used side by side in your research analysis depending on the perspectives you want to pursue.
The Usual Method
All this talk of thematic areas and affinity mapping may sound overwhelming, but in truth, researchers normally throw their notes into a canvas (Miro, Mural, or Figjam are the usual suspects), and then cluster them into topics or moments of the customer journey.
If an idea is frequently recurring within the research, then researchers typically use dots to indicate this. They may also use some in-app features that mean the same thing.
While this is similar to the thematic areas outlined above, it’s more of a flexible process.
How to Analyze Different Types of Data

Analyzing Qualitative UX Data from User Interviews
One thing you may quickly notice with qualitative data is that it can seem chaotic. This is because it’s highly subjective. You will often end up with a lot of data, most of which may be repetitive or unusable. User interviews are typically open-ended, allowing the user to express their opinions without filters. This also means analyzing the data depends largely on you, the UX researcher, and how you want to handle it.
When performing qualitative user research data analyses, pay attention to;
-
- Patterns that come up in various thematic areas;
-
- Findings that surprised your team;
-
- Moments (topics) of great emotion for users;
-
- Likes and dislikes;
-
- Features that are popular among users;
-
- And use cases that your current UI does not support well enough.
But if you are performing exploratory research for your product discovery stage, you will find that that data may contain both qualitative attitudinal data and qualitative behavioral data. By using affinity diagrams and thematic analysis, you can uncover the hidden gems in the data.
For you to perform thematic analysis, you will need 3 things; data, research preferences (based on team and goals of research), and the context of analysis. Armed with these, you can perform your UX research data analysis with software, through journaling, or through affinity diagrams.
How Can GPT Help?
Everyone knows GPT by now, the AI-powered tech that’s definitely not secretly planning world domination by making humans over-reliant on technology and forgetting what the great outdoors feel like so that we willingly embrace the real-life matrix. Not at all.
@tldv.io Written by ChatGPT #inception #chatgpt #ai #openai #meeting #corporate
♬ original sound - tldv.io - AI Meeting Recorder
Anyway, before we become batteries for robots, we can use them to speed up our work life and pick up things we may have missed. For example, you can feed GPT your research and ask it to point out biases, find patterns and themes, and even highlight likes and dislikes. Essentially, everything we outlined for you above when it comes to user feedback analysis can be performed instantly by a bodiless robot.
GPT Prompts
Here are some GPT prompts you can use to make your UX research report even more persuasive!
- Can you search the repository for all research related to a specific product or feature?
- Can you summarize the key findings of a particular study for me?
- Can you organize the research studies by date, author, or topic?
- Can you identify any common themes or patterns that emerge from the research studies?
- Can you help me identify gaps in our current understanding of user behavior or preferences?
- Can you provide me with a summary of the research methods used in a particular study?
- Can you help me create a presentation that summarizes the research findings for a specific project or initiative?
- Can you suggest potential follow-up studies or research questions based on the current findings?
- Can you provide me with a list of external research studies or sources that may be relevant to our research repository?
While these questions may seem a little vague, they allow GPT to explain to you in detail what it needs from you. Let’s take prompt #7 as an example. Here’s GPT’s response: