Przejdź do treści







Podsumowanie: Claude Dashboards
Pulpit nawigacyjny Claude’a to artefakt działający w czasie rzeczywistym – strona tworzona przez Claude’a w serwisie Cowork, która po otwarciu pobiera aktualne dane z różnych źródeł. Funkcja ta jest dostępna w płatnych planach Claude’a w wersji na komputery stacjonarne.
Jego utworzenie zajmuje około pięciu minut. Wystarczy wskazać Claude’owi, gdzie przechowywane są dane, opisać potrzebne panele, a on je utworzy.
Aplikacja nie aktualizuje danych w tle. Aby dane zostały odświeżone, trzeba ją otworzyć.
Stworzyłem jeden na podstawie arkusza sprzedaży zawierającego 400 wierszy, aby sprawdzić, czy program potrafi poprawnie wyświetlać dane liczbowe i zapewnić mi funkcjonalny pulpit analityczny. Program zdołał odczytać cały plik, w tym kilka pułapek, które umieściłem, by sprawdzić, jak daleko sięga jego działanie. Wykresy wymagały jednak dokładniejszej weryfikacji. Dwa z nich zostały wygenerowane nieprawidłowo, zanim Claude wykrył sam problem.
Pulpit nawigacyjny Claude to strona działająca w czasie rzeczywistym, która gromadzi dane użytkownika w jednym, dostosowanym do indywidualnych potrzeb widoku. Są to tzw. „artefakty na żywo” według serwisu Anthropic . Wprowadzone w kwietniu 2026 r. stanowią one w praktyce sposób na przekształcenie Claude’a w narzędzie do raportowania, a nawet w pulpit nawigacyjny służący do coachingu sprzedażowego.
Jego utworzenie zajmuje około pięciu minut. Wystarczy wskazać Point Claude źródło danych, takie jak arkusz kalkulacyjny lub system CRM, określić rodzaje paneli, które chcesz uwzględnić, a narzędzie wygeneruje stronę, która pobiera zaktualizowane dane za każdym razem, gdy ją otworzysz.
Najważniejsze jest to, że trzeba go otworzyć. Obecnie nie wypełnia się on automatycznie, a po zamknięciu laptopa plik pozostaje bez zmian.
Sam stworzyłem taki dokument, korzystając z arkusza sprzedaży zawierającego 400 wierszy, w którym wszystkie sumy zostały obliczone, zanim Claude zapoznał się z danymi, a następnie porównałem uzyskane wyniki z danymi źródłowymi.
Czym jest pulpit nawigacyjny Claude?
Pulpit nawigacyjny Claude’a to artefakt działający w czasie rzeczywistym. Jest to trwała strona HTML tworzona przez Claude’a w Cowork, która przy każdym otwarciu ponownie łączy się z wybranymi źródłami danych.
Różnica między tym rozwiązaniem a zwykłą odpowiedzią Claude’a polega na tym, gdzie jest ono przechowywane i jak się zachowuje, gdy wrócisz do niego później. Jeśli zadasz Claude’owi pytanie, otrzymasz odpowiedź na czacie, natomiast artefakt na żywo jest zapisywany osobno w pasku bocznym i zachowuje historię wersji, którą możesz przewijać wstecz.
This is a feature that is limited to certain Claude account types and must be used with the desktop app, not the browser version of Claude. Live artifacts are available on paid Claude plans, such as Pro, Max, Team, and Enterprise. Building and refreshing dashboards draws on the same allowance as your chats, so it’s worth knowing how Claude usage limits work before you build several.
Many people are being guided to try it by Claude suggesting it in the message box.
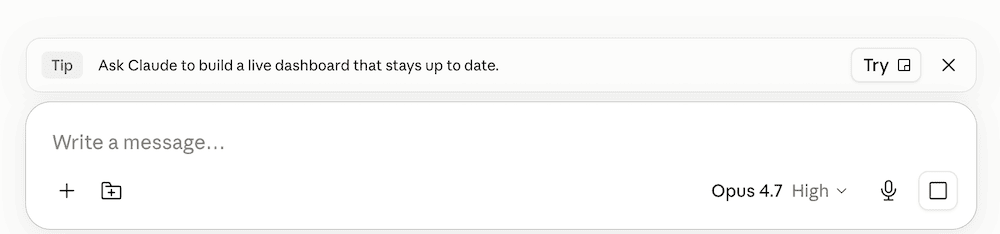
Jeśli korzystasz już z Claude Projects, wynikiem jest artefakt na żywo, a nie obszar roboczy. Kontekst przechowują projekty.
Po co tworzyć pulpit nawigacyjny Claude?
W każdy poniedziałek rano przeglądasz dane, aby sprawdzić aktualny stan. Może to wymagać zaledwie kilku kliknięć, ale może też zająć kilka godzin przeglądania różnych źródeł danych.
Dane tam są, ale utknęły w systemie CRM, którego pulpit nawigacyjny został zaprojektowany przez zespół dostawcy, a który niekoniecznie zawiera to, czego potrzebujesz do codziennej pracy.
Panel Claude pozwala opisać potrzebne panele w zaledwie kilku zdaniach, a strona jest tworzona zgodnie z Twoimi wytycznymi, a nie na podstawie gotowego szablonu. Załóżmy na przykład, że jesteś kierownikiem sprzedaży i chcesz co tydzień wiedzieć, które transakcje utknęły w martwym punkcie, jak wygląda proces sprzedaży w poszczególnych etapach oraz którzy z Twoich przedstawicieli mają zaległości w działaniach następczych. Trzy panele, po jednym zdaniu na każdy, zawierające odpowiednie dane.
Jest to również szybsze. Twój zespół inżynierów mógłby stworzyć dla Ciebie niezwykle rozbudowany pulpit nawigacyjny, ale zanim zostanie on wdrożony, wartość, do której dążyłeś, już się zmieniła. Pulpit nawigacyjny Claude’a możesz dostosować samodzielnie.
Trzy rzeczy nazywane są artefaktami
Słowo „artefakt” ma w programie Claude trzy różne znaczenia.
Elementy czatu
Wprowadzone w 2024 roku są to panele wyników, które otwierają się obok zwykłej rozmowy w aplikacji Claude.
Cowork – pamiątki związane ze sztuką na żywo
Funkcja ta została uruchomiona w kwietniu 2026 r. i jest dostępna wyłącznie na komputerach stacjonarnych w ramach płatnych planów. Jest to jedyny rodzaj artefaktu, który może samodzielnie cofnąć się w czasie i uzyskać dostęp do źródeł danych.
Artefakty Claude’a Code’a
Strony te, uruchomione w czerwcu 2026 r., zostały wygenerowane w ramach sesji programistycznej i powstały w kontekście tej konkretnej sesji, z uwzględnieniem Twojego kodu źródłowego.
| Elementy czatu | Artefakty z Cowork Live | Artefakty Claude Code | |
|---|---|---|---|
| Uruchomiono | 2024 r., MCP dodano w październiku 2025 r. | 20 kwietnia 2026 r. | 18 czerwca 2026 r. |
| Gdzie przebiega | Internet, komputery stacjonarne, urządzenia mobilne | Tylko wersja Claude Desktop | Dowolna przeglądarka |
| Plany | Bezpłatnie w górę | Pro, Max, Team, Enterprise | Wersja beta dla zespołów i przedsiębiorstw |
| Odśwież | Wartość statyczna, chyba że zostanie przebudowana | W trybie otwartym, z krótką pamięcią podręczną | Aktualizacje w trakcie sesji |
| Udostępnianie | Dostępny link publiczny | Zespół i firma – wyłącznie do użytku wewnętrznego | Link do udostępnienia |
Warto również zauważyć, że zaplanowane zadania w Cowork są wykonywane w chmurze zgodnie z ustalonym przez użytkownika harmonogramem, bez konieczności podłączenia urządzenia do Internetu. Jest to proces całkowicie automatyczny, w przeciwieństwie do artefaktu działającego w czasie rzeczywistym.
Z czego Claude może stworzyć pulpit nawigacyjny?
Istnieją trzy rodzaje źródeł, na podstawie których można stworzyć pulpit nawigacyjny Claude, a ich wybór decyduje o tym, jakie funkcje będzie on obsługiwał, a jakich nie.
System CRM
Pipedrive, Salesforce, HubSpot. Moduł łączący sam przeprowadza uwierzytelnianie i przechowuje dane uwierzytelniające. Dzięki temu żadne dane użytkownika nie muszą być publicznie dostępne.
HubSpot posiada własny łącznik, ale przed podłączeniem go przez innych użytkowników musi to zrobić superadministrator lub użytkownik z uprawnieniami do App Marketplace. Działa on w ramach bezpłatnego planu HubSpot, ale nadal wymaga płatnego konta Claude. Pipedrive uruchomiło we czerwcu 2026 r. własny serwer MCP we wszystkich planach, dodany jako łącznik niestandardowy. Salesforce korzysta z własnego hostowanego serwera MCP z OAuth i zewnętrzną aplikacją kliencką, więc jego konfiguracja zajmuje więcej czasu.
Wszystkie trzy przejmują uprawnienia skonfigurowane w systemie CRM, więc osoba bez pełnego dostępu zobaczy na swoim pulpicie mniej danych. To dobre rozwiązanie z punktu widzenia prywatności, ale może być kłopotliwe, gdy dwie osoby porównują dane.
Arkusz kalkulacyjny
Jeśli wolisz tradycyjne rozwiązania, jako źródło danych może posłużyć również regularnie aktualizowany arkusz kalkulacyjny – na przykład Arkusze Google lub plik CSV w Dysku. Wystarczy wskazać plik w Point Claude, a program go odczyta.
Dobrą wiadomością jest to, że odczytuje całość za jednym razem, bez konieczności zajmowania się paginacją. Przetestowałem to na arkuszu zawierającym 400 wierszy i odczytał go w całości.
Jest jednak pewien haczyk. Uprawnienia. Pulpit nawigacyjny jest w zasadzie stroną internetową i nie może zalogować się na konto Google ani nie posiada własnego loginu Google. Dlatego może odczytywać tylko arkusze, do których nie wymaga logowania. Aby uzyskać odświeżanie na żywo, musisz ustawić arkusz na opcję „każdy, kto ma link, może przeglądać”, co rodzi kwestie związane z bezpieczeństwem i prywatnością danych. Arkusz, którego użyłem, był fikcyjny i zawierał zmyślone dane oraz transakcje, ale w przypadku danych wrażliwych nie jest to rodzaj informacji, do których chcesz, aby dostęp miał każdy, kto posiada link.
Warstwa magazynowa lub warstwa BI
Osoby o bardziej technicznym zacięciu mogą skorzystać z Snowflake, BigQuery lub modelu semantycznego Power BI. Nie ma tu przełącznika typu „włącz/wyłącz”. Należy skierować Claude’a na niestandardowy serwer MCP, który ktoś musi uruchomić i utrzymywać, a który musi być dostępny przez publiczny internet, ponieważ Claude łączy się z chmurą serwisu Anthropic, a nie z Twoim komputerem.
Jedną z pierwszych implementacji stworzył Kurt Buhler w kwietniu 2026 roku. Podłączył on aktywny artefakt do modelu semantycznego Power BI i przeprowadził zapytanie przy użyciu języka DAX. Opisał wyniki jako powolne, ale interesujące, i uznał, że problem z powolnością można rozwiązać.
Jeśli Twoje dane znajdują się już w hurtowni danych, prawdopodobnie dysponujesz narzędziem BI, które umożliwia zaplanowane odświeżanie danych oraz udostępnianie linków – a żadnej z tych funkcji nie oferuje artefakt na żywo. Chociaż teoretycznie jest to możliwe, w tym przypadku artefakty na żywo prawdopodobnie pozostają o krok w tyle za tym, co już posiadasz.
Jak stworzyć pulpit nawigacyjny Claude’a
Postanowiłem stworzyć własny pulpit nawigacyjny Claude’a od podstaw, korzystając z fikcyjnych danych dotyczących lejka sprzedażowego, aby sprawdzić, jak łatwo jest go stworzyć. Zajęło mi to kilka minut pracy, trochę czasu na oczekiwanie, a efekt okazał się dość pouczający.
Zanim zaczniesz
Potrzebujesz aplikacji Claude Desktop w najnowszej wersji, płatnego planu Claude (ja korzystałem z planu Max) oraz źródła danych z podłączonym łącznikiem (w tym przykładzie – Google Drive).
Zalecałbym podłączenie źródeł danych przed utworzeniem artefaktu, ponieważ choć Claude często wyświetla monit o podłączenie źródła w trakcie tworzenia, to dzięki wcześniejszemu podłączeniu może od razu uzyskać dostęp do danych, zamiast zatrzymywać się, by zapytać o to użytkownika.
Kroki
1. Najpierw należy przenieść dane w miejsce, do którego Claude ma dostęp
Arkusz w Google Drive lub system CRM z włączonym modułem łączącym. Arkusz kalkulacyjny powinien zawierać tylko jedną kartę. Zgodnie z dokumentacją moduł łączący z Drive odczytuje jedynie pierwszą kartę pliku zawierającego wiele kart, nie sygnalizując przy tym, że pominął pozostałe.
2. Podłącz źródło
Ustawienia, a następnie Łączniki. W planach Team i Enterprise właściciel musi dodać niestandardowe łączniki na poziomie organizacji, zanim ktokolwiek inny będzie mógł się z nimi połączyć.
3. Wybierz opcję „Cowork”, a nie „Chat”
W lewym dolnym rogu okna wiadomości znajduje się mały przycisk wyboru. Wybierz opcję „Cowork”. W zwykłym czacie nie ma elementów Live.
4. Napisz polecenie
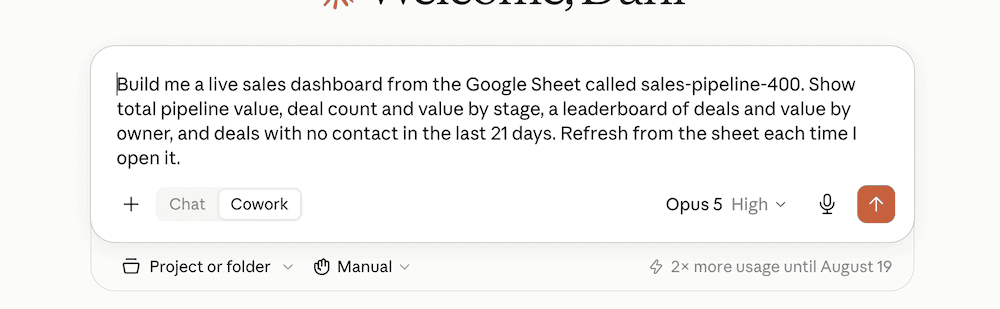
Podaj nazwę źródła, nazwy wykresów, które chcesz wyświetlić, i zaznacz, że mają się odświeżyć po otwarciu. Moje:
Stwórz dla mnie interaktywny pulpit sprzedażowy na podstawie arkusza Google o nazwie „sales-pipeline-400”. Wyświetlaj łączną wartość portfela sprzedaży, liczbę transakcji i ich wartość w podziale na etapy, ranking transakcji i ich wartości według osób odpowiedzialnych oraz transakcje, w przypadku których nie nawiązano kontaktu w ciągu ostatnich 21 dni. Odświeżaj dane z arkusza za każdym razem, gdy go otwieram.
Jeśli Twoje dane znajdują się w systemie CRM, Claude zazwyczaj sam ustali, który łącznik będzie najbardziej odpowiedni. Na przykład, jeśli podłączony jest HubSpot, system rozpozna, że to właśnie tam znajdują się dane. Oto podpowiedź dotycząca wykorzystania tego istniejącego już systemu CRM:
Stwórz interaktywny pulpit sprzedażowy, który będzie na bieżąco aktualizowany. Pobierz dane dotyczące potencjalnych transakcji mojego zespołu i wyświetlaj otwarte transakcje w podziale na etapy, transakcje, które utknęły w martwym punkcie z powodu braku kontaktu od ponad 21 dni, wskaźnik zamkniętych transakcji w bieżącym kwartale w porównaniu z poprzednim oraz ranking przedstawicieli handlowych według liczby rozmów zarejestrowanych w tym tygodniu. Odświeżaj pulpit za każdym razem, gdy go otwieram, abym zawsze widział dzisiejsze dane, a nie migawkę z momentu, kiedy ostatnio o to pytałem.
5. Odpowiedz na pytania, zanim program się uruchomi
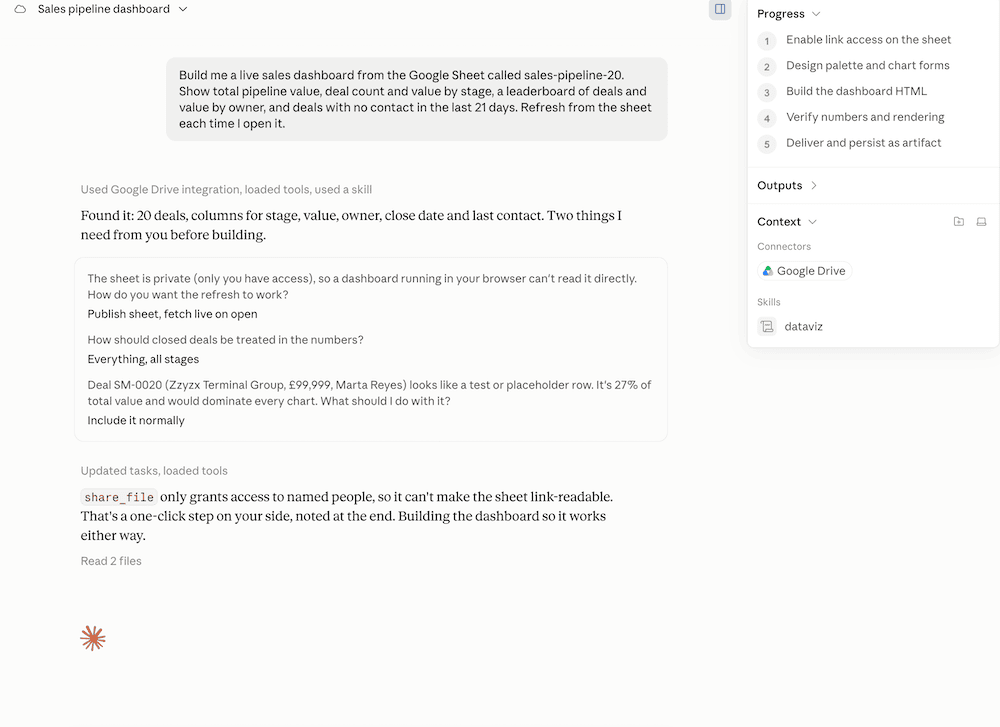
Claude wrócił z trzema pytaniami, zanim zaczął pisać kod. Jak powinno działać odświeżanie, biorąc pod uwagę, że arkusz jest prywatny? Czy zamknięte transakcje powinny być uwzględniane w sumach? I jeden wiersz wyglądał na symbol zastępczy, stanowiący 27% całkowitej wartości – co należy z nim zrobić?
Najważniejsze jest pierwsze pytanie, a w następnej sekcji wyjaśniono, dlaczego.
6. Obserwuj, co robi z własnej inicjatywy
Claude samodzielnie załadował moduł do wizualizacji danych i odczytał dwa z jego plików referencyjnych, więc kolory i typy wykresów w gotowym pulpicie nawigacyjnym pochodziły częściowo z modułu, którego nigdy nie uruchomiłem. Przed rozpoczęciem pracy sporządził sobie listę zadań składającą się z pięciu kroków. Podczas weryfikacji wykrył dwa własne błędy renderowania oraz błąd walutowy z wcześniejszej części rozmowy, a następnie naprawił wszystkie trzy przed przekazaniem jakichkolwiek wyników. Sprawdził swoje wyniki w oparciu o dane źródłowe, zamiast zakładać, że wykresy są poprawne.7. Znajdź to ponownie
Artefakt zostanie zapisany w widoku „Artefakty” na pasku bocznym. Po otwarciu tego widoku zostaną pobrane aktualne dane.Czy musisz opublikować swoje dane, aby stworzyć pulpit nawigacyjny Claude?
Z pliku – tak. Z złącza – nie.
Aktywny artefakt utworzony na podstawie prywatnego arkusza Google Sheets nie może odczytać tego arkusza, dopóki nie będzie on dostępny dla wszystkich osób posiadających link.
Claude też nie potrafi tego obejść. Kiedy to przetestowałem, program sprawdził uprawnienia do pliku, zidentyfikował mnie jako właściciela, a następnie przeanalizował schemat działania narzędzia do udostępniania w Dysku i stwierdził, że może przyznawać uprawnienia wyłącznie określonym adresom e-mail. Nie było tam opcji „każdy, kto ma link”, więc przerwał proces i poprosił mnie o wykonanie tej czynności ręcznie.
Najlepszym sposobem na obejście tego problemu jest pobieranie danych z danego źródła, np. systemu CRM, wyłącznie za pomocą łącznika.
Czy pulpity nawigacyjne Claude’a aktualizują się automatycznie?
Nie samodzielnie. Pulpity nawigacyjne aktualizują się po ich otwarciu. Nie aktualizują się w tle, gdy są nieaktywne. Masz do dyspozycji stronę, która potrafi pobierać dane na żądanie. Po zamknięciu komputera nic się nie dzieje. AnthropicW dokumentacji serwisu jest napisane, że otwarcie artefaktu powoduje pobranie danych z połączonych aplikacji, a krótkotrwała pamięć podręczna przechowuje najnowsze dane, dzięki czemu strona ładuje się szybko. Dostępny jest przycisk odświeżania, który można nacisnąć, aby wymusić nowe zapytanie. Nie ma wykonywania zadań w tle. Funkcją, która działa samodzielnie, są zaplanowane zadania Cowork; są one wykonywane w chmurze, nawet gdy urządzenie nie jest podłączone do sieci. Nie jest to jednak cecha artefaktów działających na żywo. Ponadto, jeśli pracujesz na wielu urządzeniach, pulpit nawigacyjny działa lokalnie. Przełącz się z komputera stacjonarnego na laptopa przed wyjazdem, a Twoje artefakty na żywo nie będą tam dostępne. Warto zwrócić uwagę na jedną rzecz w mojej kompilacji: jeśli pobieranie danych nie powiedzie się z jakiegokolwiek powodu, informacja o tym pojawia się na dole artefaktu. Wiersz stanu wskazuje, czy dane są aktualne na żywo, czy pochodzą z zapisanej kopii, co stanowi zabezpieczenie przed błędnym założeniem, że liczby są aktualne na żywo.Czy można udostępnić pulpit nawigacyjny Claude’a?
Dotyczy to wyłącznie planów Team i Enterprise oraz wyłącznie w ramach własnej organizacji. Użytkownicy planów Pro i Max mogą co prawda tworzyć artefakty, ale nie mają możliwości ich udostępniania ani publikowania w trybie na żywo. Żaden plan nie pozwala na ich upublicznienie.
Jeśli zamierzałeś wysłać klientowi link do pulpitu nawigacyjnego, ta funkcja nie będzie działać.
Udostępnianie treści wewnątrz organizacji ma również pewne ograniczenia. Nie ma możliwości dodawania linków zewnętrznych ani wybierania konkretnych odbiorców, którym chcesz udostępnić swój widok. To, co pojawia się na udostępnionym pulpicie nawigacyjnym, zależy również od uprawnień danego użytkownika, więc ta sama strona może wyświetlać różne dane różnym osobom.
Czy pulpity nawigacyjne Claude’a są dokładne?
Tak, sumy były prawidłowe. Trzeba było sprawdzić wykresy.
Jak to przetestowałem
Stworzyłem dwa arkusze kalkulacyjne. Jeden zawierał 20 wierszy z fikcyjnymi danymi dotyczącymi rurociągu, a drugi – bardziej obszerny – liczył 400 wierszy. Przed przekazaniem Claude’owi obu plików obliczyłem i zapisałem sumy z każdego z nich.
W większym pliku zawierającym 400 wierszy przygotowałem kilka elementów, aby sprawdzić, jak dokładnie i dogłębnie przebiega odczyt. W pliku, za wierszem 100, umieściłem pięć większych transakcji. Gdyby program Claude odczytał tylko pierwszą część arkusza, pominąłby te transakcje, a wyniki byłyby niekompletne. Sprawdzałem, czy program odczyta cały plik, czy też po pierwszych stu wierszach przełączy się na tryb wyszukiwania.
Dodałem też drugi test – jeden etap transakcji, który pojawił się tylko raz w całym pliku, w ostatnim wierszu. Gdyby pulpit nawigacyjny wyświetlił siedem etapów transakcji zamiast sześciu, które pojawiły się w pierwszych 399 wierszach, mógłbym mieć pewność, że odczytał plik w całości.
Suma
Wszystkie dane liczbowe były poprawne. Znajdowało się tam wszystkie pięć umów wprowadzonych celowo, a wszystkie siedem etapów transakcji zostało uwzględnionych. Sumy dla poszczególnych właścicieli również były poprawne. Program zdołał odczytać cały plik i sporządzić dokładny raport.

Wykresy
Za pierwszym razem wykresy nie były wiarygodne, choć Claude zwrócił na to uwagę jeszcze przed dostarczeniem pulpitu nawigacyjnego.
Claude narysował wykres słupkowy i obliczył, jak szeroki powinien być, porównując największą wartość z górną krawędzią osi. Jednak ustawił górną krawędź osi zbyt nisko – niżej niż największa liczba w danych. W rezultacie słupki były większe niż sam wykres, na którym się znajdowały.
Po drugie, jeden słupek zajmował 99,766% szerokości wykresu, więc wydawał się największym odcinkiem. Problem polegał na tym, że stanowił on zaledwie 29% rzeczywistej całości. Wyglądało to wiarygodnie, ale w rzeczywistości było błędne.
Automatyczna kontrola układu wykazała, że wszystko jest w porządku. Problemy ujawniły się dopiero po wydrukowaniu rzeczywistych szerokości słupków i porównaniu ich ze skalą. Jeśli więc zamierzasz przedstawić to na spotkaniu, przeprowadź wcześniej szybką weryfikację w oparciu o plik źródłowy. Sumy były poprawne w całym pliku. Nie dotyczyło to jednak wykresu, na którym zostały one przedstawione.
Czy warto stworzyć pulpit nawigacyjny Claude’a?
Tak, jeśli chcesz mieć wgląd w swoje własne dane i wyniki bez konieczności zgłaszania zgłoszenia lub nauki obsługi narzędzia BI, i nie przeszkadza Ci to, że dane aktualizują się dopiero po otwarciu pliku, a nie na bieżąco.
Jeszcze nie, jeśli chcesz to wysłać klientowi, jeśli musi to być aktualne, nawet jeśli nikt tego nie przegląda, albo jeśli nie może to być dostępne za linkiem, który działa dla każdego, kto ma adres URL.
Warto zastanowić się, z czym jeszcze można to powiązać. Wiele informacji, które kierownik sprzedaży chce mieć pod ręką – z kim rozmawiano, co ustalono – nie zawsze znajduje się wyłącznie w systemie CRM, ale wynika z przeprowadzonych rozmów telefonicznych.
Warto też zastanowić się, z czym jeszcze można to połączyć. Wiele informacji, które kierownik sprzedaży chce mieć pod ręką – z kim rozmawiano, co uzgodniono – nie zawsze znajduje się wyłącznie w systemie CRM, ale wynika z przeprowadzonych rozmów telefonicznych. Serwer MCP serwisutl;dv działa w trybie tylko do odczytu i jest uwierzytelniany za pomocą protokołu OAuth, więc łączy się z Claude’em bez konieczności eksportowania danych w celu ich opublikowania.
Niezależnie od tego, co podłączysz, i niezależnie od tego, jakie pulpity nawigacyjne utworzysz, pamiętaj, aby przed podjęciem jakichkolwiek działań przeprowadzić wyrywkową weryfikację z danymi źródłowymi.
Najczęściej zadawane pytania dotyczące paneli Claude
Jak stworzyć pulpit nawigacyjny w Claude?
Uruchom aplikację Claude Desktop, wybierz opcję „Cowork” w oknie komunikatu i połącz się ze źródłem danych. Następnie opisz żądane panele i nadaj nazwę źródłu. Claude tworzy artefakt na żywo, który jest zapisywany w widoku „Artefakty” na pasku bocznym. Wymagany jest płatny plan Claude, a funkcja ta działa wyłącznie na komputerach stacjonarnych.
Czy pulpity nawigacyjne Claude aktualizują się automatycznie?
Nie działają samodzielnie. Pobierają aktualne dane po ich otwarciu; mają krótką pamięć podręczną oraz przycisk odświeżania w nagłówku, jeśli chcesz wymusić odświeżenie. Gdy pulpit nawigacyjny jest zamknięty, nic się nie dzieje. Zaplanowane zadania w Cowork to odrębna funkcja, która działa w chmurze bez udziału twojego komputera.
Czy mógłbyś udostępnić pulpit nawigacyjny Claude’a?
Dostępne wyłącznie w planach Team i Enterprise oraz wyłącznie w ramach własnej organizacji. Użytkownicy planów Pro i Max mogą je tworzyć, ale nie mogą ich udostępniać ani publikować, a żaden plan nie pozwala na upublicznienie takiego dokumentu. Osoby, którym udostępnisz dokument, widzą dane zgodnie z własnymi uprawnieniami do łącznika, więc ich wersja może zawierać mniej informacji niż Twoja.
Czy Claude przegląda każdy wiersz dużego arkusza kalkulacyjnego?
W naszym teście – tak. Odczytano wszystkie 400 wierszy, a każda suma była zgodna z danymi źródłowymi, w tym transakcje umieszczone głęboko w pliku w celu wykrycia częściowego odczytu. Nie przetestowano tutaj większych plików ani źródeł CRM, które przekazują dane w postaci stron.
Czy dane muszą być publiczne, aby stworzyć pulpit nawigacyjny Claude?
Z arkusza Google – tak. Arkusz musi być widoczny dla każdego, kto posiada link, ponieważ pulpit nawigacyjny nie posiada własnego systemu logowania. Łącznik CRM pozwala uniknąć tego problemu, ponieważ uwierzytelnia się we własnym imieniu i żadne dane nie są publikowane.